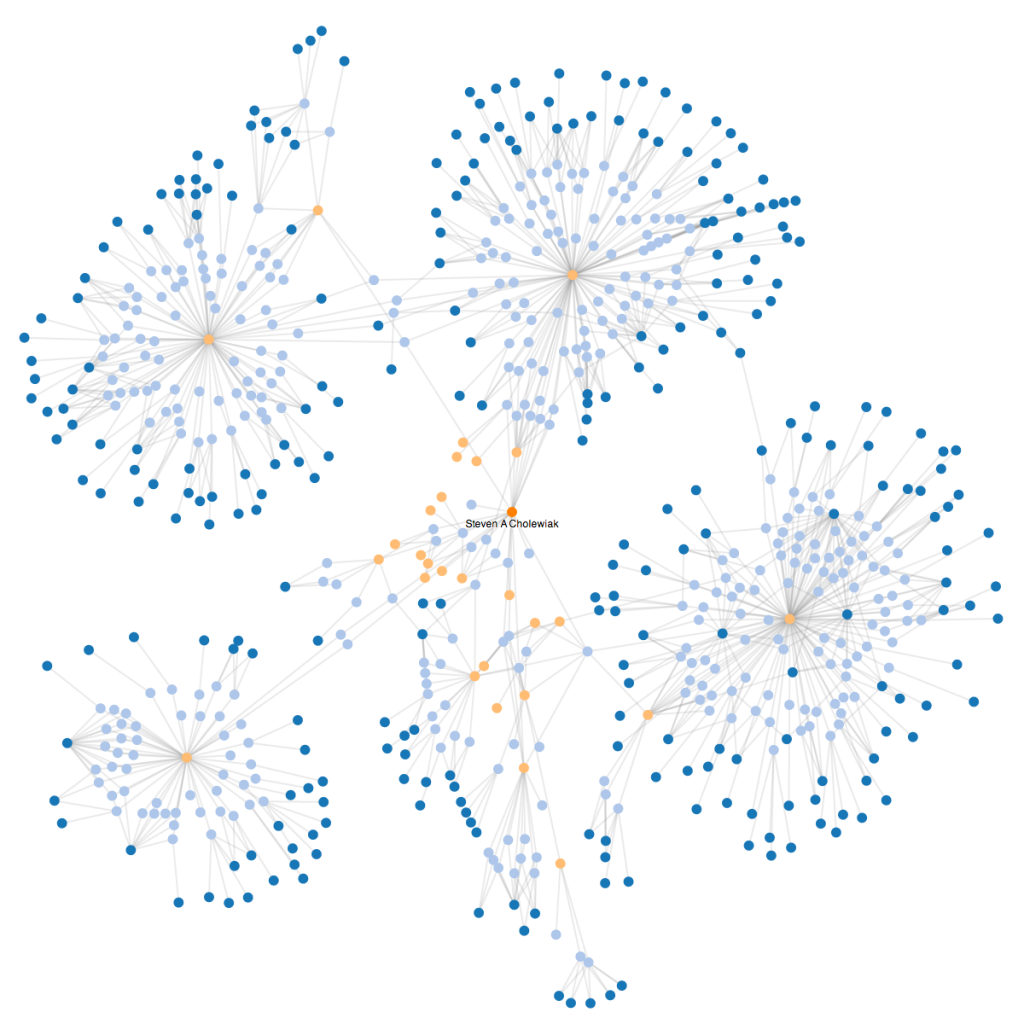
Here’s an illustration I pulled together using Python, NetworkX, and D3.js to illustrate the interconnections between abstracts that will be presented at the Vision Sciences Society 2014 annual meeting in approximately 2 weeks. Orange dots represent abstracts, Light Blue dots represent authors with at least one first authorship, and Dark Blue dots represent other authors (second through last).
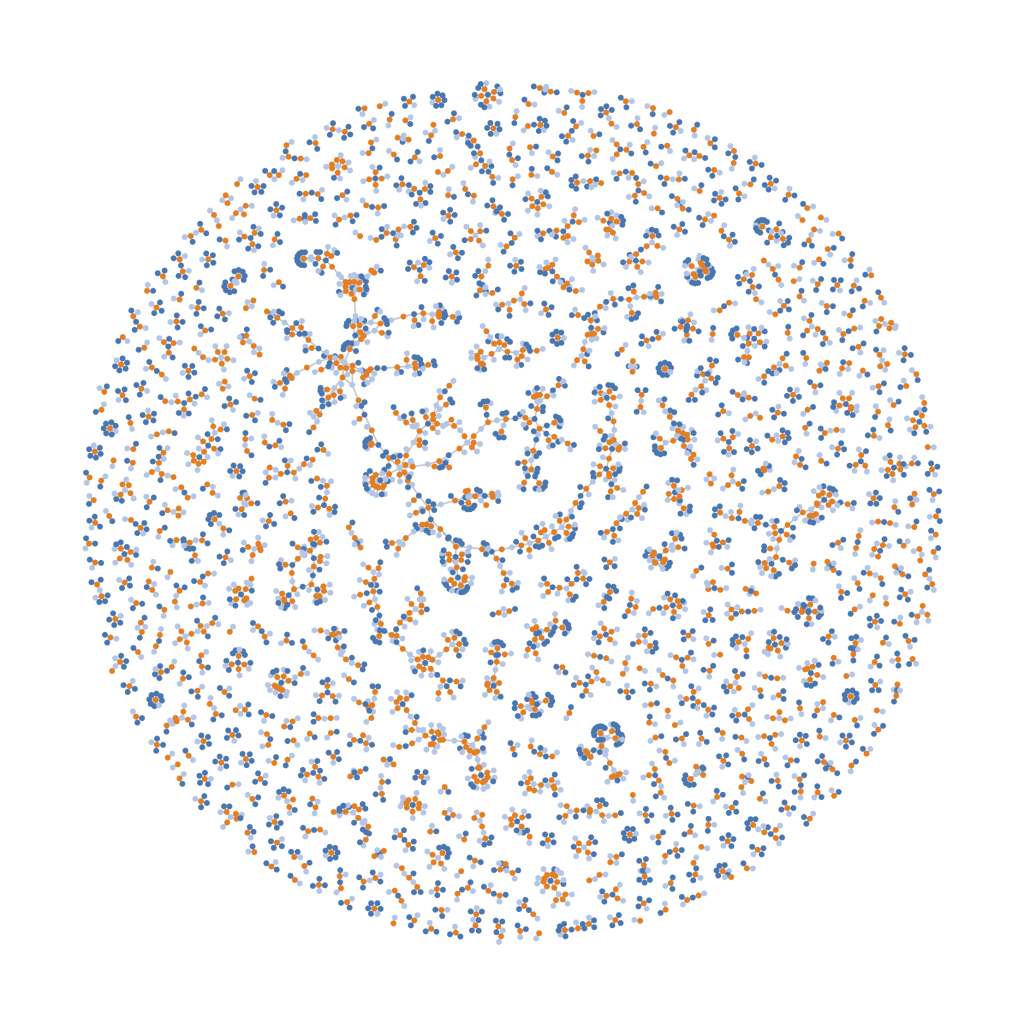
As you can see, there are large numbers of abstracts that have few shared authors. Those abstracts that share authors often join together to create “chains” of students, advisors, and colleagues.
This is a first version, hastily pulled together, so there are a few problems. The nodes are assigned to authors by name, which can be a problem for authors sharing the same name (which creates more connections than appropriate for a given node) or who have inconsistent reporting of their name (for example, omitting the middle initial or alternate spelling, which can create another erroneous node). I am thinking of addressing the duplicate node issue by using a string similarity metric (e.g., Levenshtein distance) to find strings that contain similar names to combine the connections, but this could be an issue if the names are truly different people. Alternatively, I could incorporate the authors’ affiliations, but this carries similar issues (e.g., I report my affiliation as “University of Giessen” while colleagues report it as “Justus-Liebig-Universität Gießen”).
Although there are lingering issues, it is still an interesting illustration of the connections between the different abstracts being presented at VSS 2014.
Here’s the code on GitHub: visvssrelationships