Effect of repeated JPEG compression on image quality and content

There are a number of videos online illustrating the effect of increasing JPEG (JPG) compression on both file size and image quality (see example 1, example 2, or example 3). I wanted to try recompression on my own data because the effect can be recreated quickly using a simple MATLAB script. It is a very simple demonstration of the effect of lossy image compression. For a simple demonstration of the effect of compression, I load an image into MATLAB and then progressively increase the JPEG compression (by decreasing the ‘Quality’ parameter in imwrite), saving each incremental image as a frame. I then load all of the frames and assemble them into a video file. Here’s an example of increasing image compression at 10 frames per second:


In addition, I tried recompressing the image to see the effect of repeated JPEG compression on the output. An initial image is loaded, it is compressed, then that image is loaded and compressed at a lower quality, then that image is loaded and compressed at an even lower quality, and so on and so forth. Here’s the output at 10 frames per second when we do this from the least amount of JPEG compression (‘Quality’,100) to the most amount of compression (‘Quality’,0):


Just to be artistic, we can then repeat the cycle 10x and observe the effect of repeated compression. Here is an example at 30 frames per second with 10 loops of the repeated recompression:


Click through for the MATLAB code and a couple more example videos.
Read More
Puff Pastries with Blueberry Compote

Ok, so this post is not shape or electronics related, but still a fun little side project. Since I started working at Justus-Liebig-Universität in Gießen, Germany as a postdoc, my wife and I have cooked as much homemade food as possible. Germany is full of fantastic, inexpensive, and fresh ingredients, so we want to take advantage of whatever is available seasonally.

This week, blueberries were on sale, 0,49€ for 200g, and puff pastry dough is really inexpensive as well, 0,69€ for a sheet. So, here’s my first attempt at a “foodie” video demonstrating how I made puff pastries with fresh blueberry compote, with CC-licensed music by Jill Zimmerman.


Read More

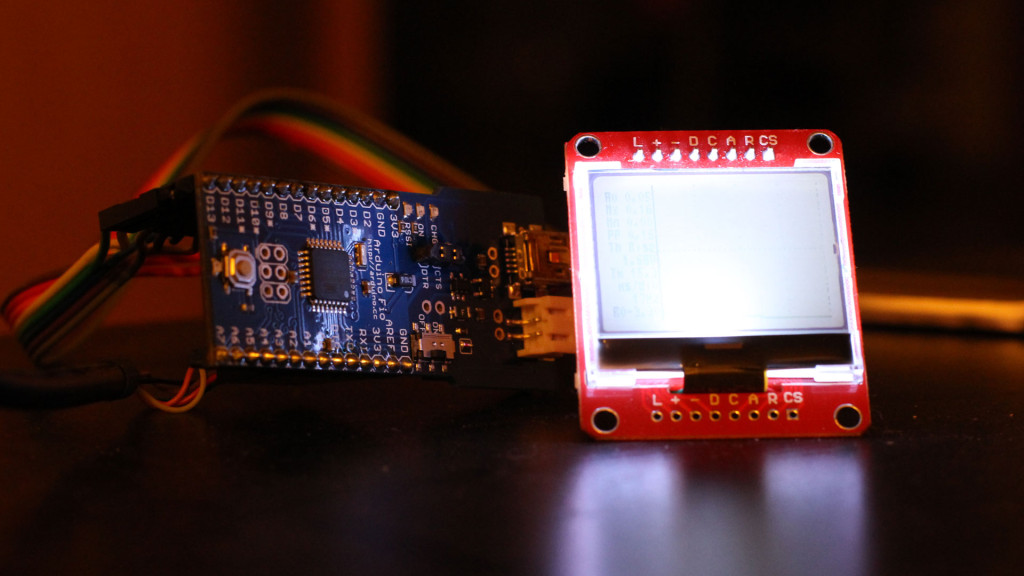
Arduino FIO LCD Oscilloscope

It has been 7 years (!) since I posted my PIC18F2550 KS0108 Graphical LCD Oscilloscope code and schematics. I have long since taken the circuit apart, sold my PIC microcontrollers, and moved on in my life (as one can surmise from my most recent posts detailing my graduate and postdoctoral work). However, I still get inquiries about the Microchip PIC oscilloscope, so I decided to recreate it using a simpler setup using my Arduino Fio.

IMG_4199

Here’s a short teaser video just to show that, yes, it works (going through a couple different sine wave frequencies, some random noise, etc. just to illustrate it working):


Click through the break to get more information on the setup.
Read More

Orientation Fields of a Rotating “Blobby” Object

In research I will be presenting in a few days at VSS (the Vision Sciences Society annual meeting), I will be demonstrating how we may use orientation flow fields of texture and shading when making perceptual judgments of 3D shape structure (see Fleming, Holtmann-Rice, & Bülthoff, 2011 for additional information). Since I find visualizations fun, I decided to use some spare CPU cycles overnight to visualize the orientation fields of a rotating blobby object.


The object on the left in the above video is a textured and shaded object with a small amount of specular reflection (lit using the Debvec Funston Beach at Sunset light probe). On the right, I’m illustrating the dominant orientations in the image, across the surface of the object.

Click through for some more visualizations.
Read More

Visual perception of the physical stability of asymmetric three-dimensional objects

I recently published an article in the Journal of Vision with my PhD advisor, Manish Singh, and my current Postdoctoral advisor, Roland W. Fleming:

Here’s the abstract:

Visual estimation of object stability is an ecologically important judgment that allows observers to predict the physical behavior of objects. A natural method that has been used in previous work to measure perceived object stability is the estimation of perceived “critical angle”—the angle at which an object appears equally likely to fall over versus return to its upright stable position. For an asymmetric object, however, the critical angle is not a single value, but varies with the direction in which the object is tilted. The current study addressed two questions: (a) Can observers reliably track the change in critical angle as a function of tilt direction? (b) How do they visually estimate the overall stability of an object, given the different critical angles in various directions? To address these questions, we employed two experimental tasks using simple asymmetric 3D objects (skewed conical frustums): settings of critical angle in different directions relative to the intrinsic skew of the 3D object (Experiment 1), and stability matching across 3D objects with different shapes (Experiments 2 and 3). Our results showed that (a) observers can perceptually track the varying critical angle in different directions quite well; and (b) their estimates of overall object stability are strongly biased toward the minimum critical angle (i.e., the critical angle in the least stable direction). Moreover, the fact that observers can reliably match perceived object stability across 3D objects with different shapes suggests that perceived stability is likely to be represented along a single dimension.

Want to cite us? Click through for the BibTeX source.
Read More

Effect of Environment Map Blur on Perceived Surface Properties

Here are a couple of quick demos, illustrating how blurring a cubic environmental map can lead to a change in the perceived roughness of the surface of 3D rendered objects.


I created a series of HDR cube maps using NVIDIA’s CubeMapGen (currently hosted on Google Code). Starting with the Debevec light probes, I applied a Gaussian blur with increasing kernel size (10°, 20°, 30°, 40°, and 50°), creating 6 cube maps (one for each blur). In the videos, the cube maps have increasing blur from left-to-right, top-to-bottom. Note that I did not tone-map or account for changes in overall exposure (so the specular reflections can appear blown-out, especially for the higher blurs). After the break, you can see the effect using different light probes (and different shapes).

Read More

Misperceived axis of rotation for objects with specular reflections

Katja Dörschner visited JLU last week and talked about her work investigating structure from motion with specular reflections and textures (see more info in her recent paper: Doerschner, Fleming, Yilmaz, Schrater, Hartung, & Kersten, 2011). She showed an interesting situation where the axis of rotation of a 3D teapot was misperceived due to the motion of the specular reflections on the surface of the teapot (see: Yilmaz, Kucukoglu, Fleming, & Doerschner, 2011), an effect first demonstrated by Hartung and Kersten (2002).

Using the OpenGL/Psychtoolbox framework I have previously described, I replicated this interesting effect. When you play the following movie, a 3D sphere (with sinusoidal perturbations) is rotated. Note the axis of perceived rotation when the object has specular reflections (1st half of the movie) and when the environment map is “painted” onto the surface (2nd half of the movie).


The physical motion of the object is the same in both cases — the object rotates around the vertical axis. When the object only has specular reflections, it appears to rotate around an oblique 45° axis, but when textured it rotates around the vertical axis. After the break, I show similar effects when the object is rotated around the horizontal axis, 45° axis, and when the spatial frequency of the perturbation is manipulated.

Read More