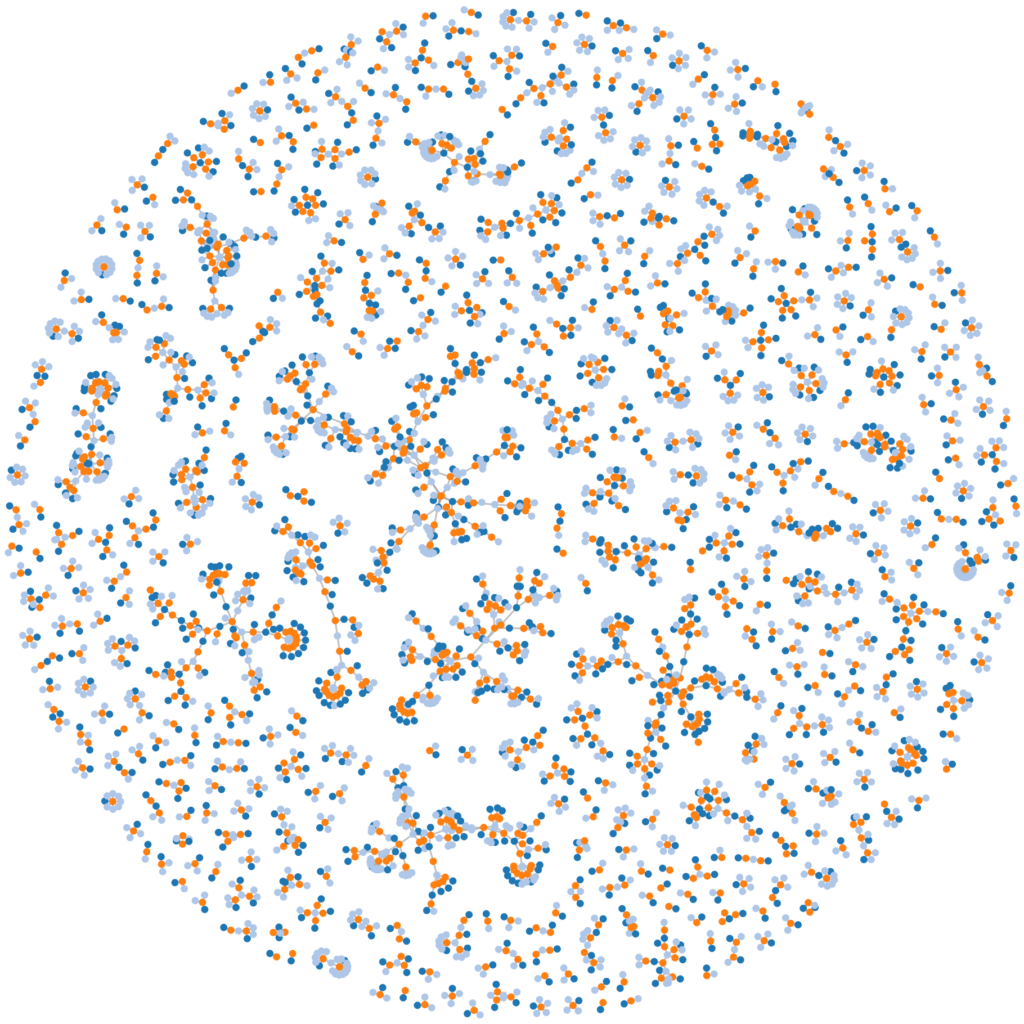
It’s been a while since I last posted one, but here’s a new Vision Sciences Society force-directed diagram of co-authorships (see past graphs here: 2014, 2015, & 2016). This year has 1293 abstracts for analysis. The graph was generated in Python using NetworkX, with authors and abstracts as nodes and edges corresponding to authorship. Individuals who are authors on more than one abstract will have edges connecting to those abstracts.

Orange dots are abstracts, light blue dots correspond to individuals who are first authors on an abstract, and dark blue dots correspond to the other author(s). You can view an interactive version here.